

Image Details
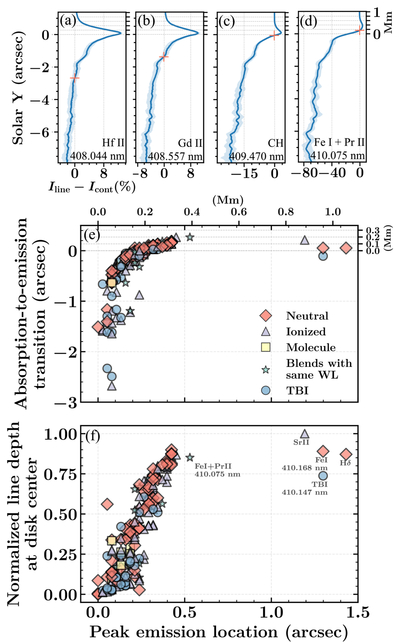
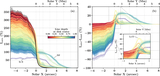
Caption: Figure 5.
(a)–(d) Four examples of the line-core (﹩{I}_{{\rm{core}}}﹩) intensity profiles after subtracting the pseudocontinuum limb profile (Icont) in the direction tangential to the flattened limb as a function of limb distance. Dark blue marks the median, and the shaded area shows the 5th and 95th percentiles. The red cross marks where ﹩{I}_{{\rm{core}}}﹩ equals Icont, indicating the limb distance where the line core starts turning into emission. Panels (e) and (f) display scatter plots of the limb distance where the different lines start going into emission (panel (e)) and the normalized line depth at disk center (panel (f)) as a function of the limb distance where the line-core emission peaks. The symbols indicate whether the line is neutral, ionized, a molecule, a blend with the same wavelength but different ionization, e.g., Fe I+Pr II, or TBI.
Other Images in This Article
Copyright and Terms & Conditions
© 2026. The Author(s). Published by the American Astronomical Society.

