

Image Details
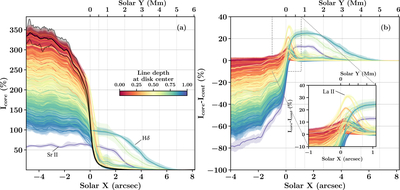
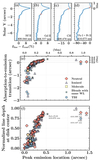
Caption: Figure 4.
Panel (a) shows the median line-core intensity as a function of limb distance for all lines within the studied wavelength range. The shaded area marks the 5th and 95th percentiles of the line-core intensity for a given height after the limb was straightened. The black line and its corresponding gray band are the limb profile obtained from the pseudocontinuum at 409.13 nm (see the shaded wavelength range in Figure 2). Profiles are color coded by the line depth normalized to the pseudocontinuum taken from the FTS spectrum at the disk center, where one is given for the strongest line, and zero represents the pseudocontinuum level (see inset color scale). (b) The same as in panel (a), but after subtracting the pseudocontinuum profile (i.e., the black line in panel (a)). The inset shows a close-up near the limb.
Other Images in This Article
Copyright and Terms & Conditions
© 2026. The Author(s). Published by the American Astronomical Society.

