

Image Details
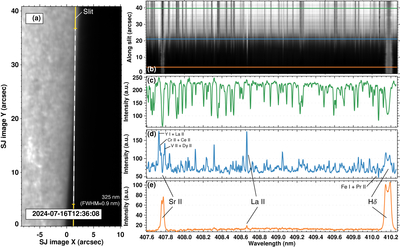
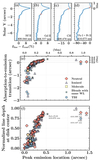
Caption: Figure 1.
SUSI data recorded around the solar limb. Panel (a) shows a portion of SUSI’s broadband slit-jaw (SJ) channel at 325 nm and a full width at half-maximum (FWHM) of 0.9 nm (A. Feller et al. 2025). The white and yellow marks show the location of the slit at the time inscribed on the panel. Panel (b) is the spectrum, and panels (c)–(e) are cuts along the green, blue, and orange lines marked in panel (b).
(An animation of this figure is available in the online article.)
(An animation of this figure is available.)
The video/animation of this figure is available in the online journal.
Other Images in This Article
Copyright and Terms & Conditions
© 2026. The Author(s). Published by the American Astronomical Society.

Copyright ©
2026 Astronomy Image Explorer. All Rights Reserved.
