

Image Details
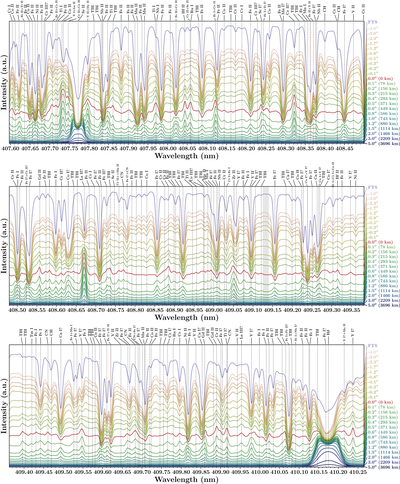
Caption: Figure 2.
Stokes I spectra covering the wavelengths between 407.6 and 410.2 nm observed by SUSI. The purple line has been taken from an FTS atlas recorded at the disk center (H. Neckel 1999). Colored lines below it represent spectra on-disk (denoted by negative heights), and above the solar limb (positive heights). The heights of the spectra are marked in the same color on the right-hand side in arcseconds and in kilometers starting at the solar limb. The spectrum right at the solar limb is highlighted in red. For better visibility, the full wavelength range is broken up into three smaller ranges.
Other Images in This Article
Copyright and Terms & Conditions
© 2026. The Author(s). Published by the American Astronomical Society.

Copyright ©
2026 Astronomy Image Explorer. All Rights Reserved.
