

Image Details
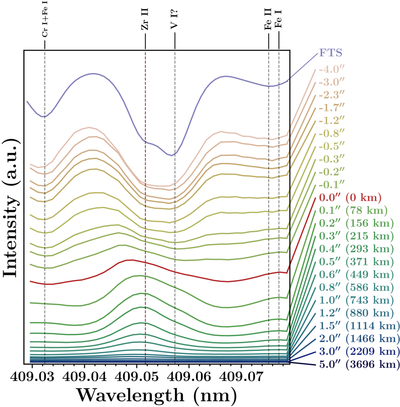
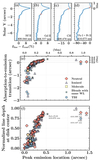
Caption: Figure 3.
Spectra at different limb distances centered on a blend of two lines, where the Zr II line, which is weaker at the disk center (see the FTS atlas in purple) becomes stronger than the main V I transition around the limb. Same layout as Figure 2.
Other Images in This Article
Copyright and Terms & Conditions
© 2026. The Author(s). Published by the American Astronomical Society.

Copyright ©
2026 Astronomy Image Explorer. All Rights Reserved.
