

Image Details
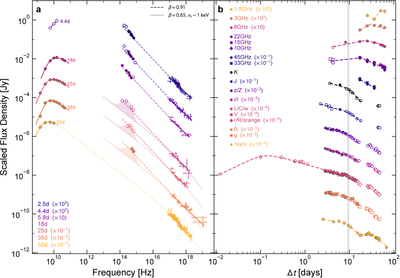
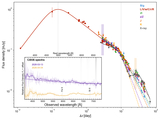
Caption: Figure 9.
Multiwavelength observations of GRB 260310A. Filled markers are data obtained in this work, with complementary public data shown as open markers. Data are rescaled for display. a. SED from 2.5 days to 50 days. The dashed lines show the extrapolation from 1 keV to the K band assuming a power-law spectrum with β = 0.91. This model can bridge the optical/NIR and X-ray bands at all epochs. However, such an extrapolation would leave little room for the SN emission that instead dominates the optical bands. The dotted lines indicate a smoothly broken synchrotron model with β ∼ 0.65 and νc ∼ 1 keV, which allows for an additional SN component (shaded blackbody models). (b). Multiwavelength light curves ranging from X-ray (bottom), through optical and NIR, to radio frequencies (top). The vertical band marks the observed temporal break in the X-ray and optical/NIR data.
Other Images in This Article
Show More
Copyright and Terms & Conditions
© 2026. The Author(s). Published by the American Astronomical Society.

