

Image Details
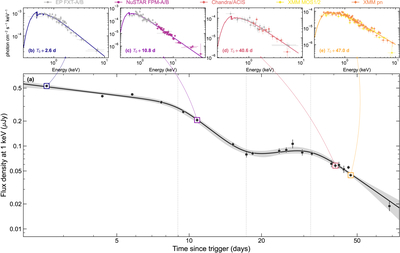
Caption: Figure 2.
X-ray observations of GRB 260310A. (a). 1 keV flux density light curve fitted with a four-segment smoothly broken power-law model (black solid line) and the associated 95% confidence region (gray shaded area). Vertical dashed lines indicate the break times. Detailed spectral views of four representative epochs: (b) T0 + 2.6 days (the initial EP/FXT epoch), (c) T0 + 10.8 days (the first NuSTAR epoch with quasi-simultaneous FXT observations), (d) T0 + 40.9 days (the Chandra epoch with quasi-simultaneous FXT observations), and (e) T0 + 47 days (the XMM-Newton epoch). The first six epochs (Interval 1) and the remaining epochs are joint-fitted using a tied intrinsic absorption and a shared photon index within each respective interval. Solid lines in the spectral panels illustrate the best-fit model for each epoch. Spectral fitting was performed on data grouped to ≥1 count per bin using the C-statistic, and data are rebinned for display purposes.
Other Images in This Article
Show More
Copyright and Terms & Conditions
© 2026. The Author(s). Published by the American Astronomical Society.

