

Image Details
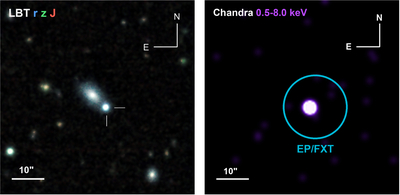
Caption: Figure 3.
Left panel: false-color LBT image of the field of GRB 260310A, constructed from the r, z, and J bands, mapped to blue, green, and red, respectively. The transient position is marked by white ticks. Right panel: 0.5–8.0 keV Chandra image of the same field, smoothed with a Gaussian kernel of σ = 2 pixels. The cyan circle marks the EP/FXT localization region. In both panels, north is up, east is to the left, and the scale bar is 10″.
Other Images in This Article
Show More
Copyright and Terms & Conditions
© 2026. The Author(s). Published by the American Astronomical Society.

Copyright ©
2026 Astronomy Image Explorer. All Rights Reserved.
