

Image Details
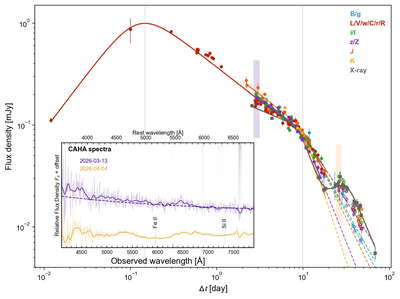
Caption: Figure 4.
Multicolor optical and NIR light curves of GRB 260310A, compared to the X-ray light curve (gray squares). Data were rescaled to the R band assuming Fν ∝ ν−β with β = 0.91. The absolute X-ray flux is shown in Figure 2(a). The red solid line shows the best-fit temporal model, describing the early optical data. Dashed lines show the late-time decay in different colors. Vertical bars mark the two epochs of optical spectroscopy. Inset: CAHA spectra observed on 2026, March 13 and April 4, corrected for Galactic extinction. To guide the eye, the dashed line shows a power-law spectrum with slope 0.91. The observed spectra are plotted as semi-transparent lines, with smoothed solid lines for plotting purposes. Smoothing is performed using a Gaussian kernel with a standard deviation of 5 pixels. Wavelengths affected by telluric absorption and sky emission are marked by gray and pink areas, respectively (S. D. Lord 1992).
Other Images in This Article
Show More
Copyright and Terms & Conditions
© 2026. The Author(s). Published by the American Astronomical Society.

