

Image Details
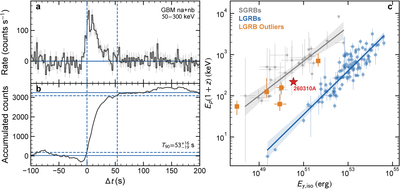
Caption: Figure 1.
Prompt emission properties of GRB 260310A. (a). Fermi/GBM count-rate light curves from NaI detectors na and nb in the 50–300 keV energy band. The black lines and gray lines represent the net counts and errors with a bin size of 2 s. (b). Accumulated counts. The blue horizontal solid (dashed) lines are drawn at 0%–100% (5%–95%) of the total accumulated counts. The vertical lines in (a) and (b) represent the T90 interval. (c). Amati relation diagram (L. Amati et al. 2002; B.-B. Zhang et al. 2018a, 2018b). Type I (short) and Type II (long) GRBs are shown as gray and blue circles, and the corresponding solid lines and dashed regions are the best-fit models and 95% c.l., respectively. The red star marks the position of GRB 260310A. Other outliers (GRBs 980425, 031203, 061021, 161219B, and 171205A) are marked as orange squares.
Other Images in This Article
Show More
Copyright and Terms & Conditions
© 2026. The Author(s). Published by the American Astronomical Society.

