

Image Details
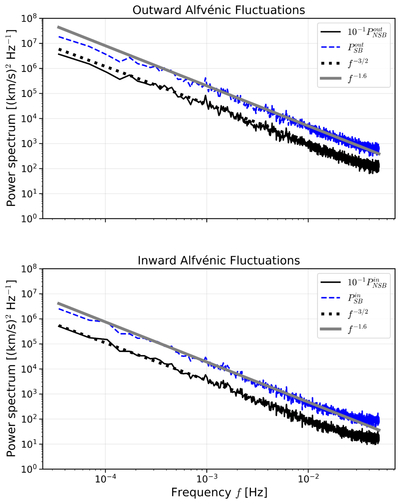
Caption: Figure 4.
Power spectral densities of the outward, Pout (top panel), and inward, Pin (bottom panel) corresponding to Elsässer fluctuations, zout and zin, for switchback (blue dashed curves) and nonswitchback (black solid curves) intervals. The spectra are plotted as a function of frequency in the spacecraft frame. The dotted and solid reference lines indicate power-law scalings proportional to f−3/2 and f−1.6, respectively. The power spectra corresponding to the nonswitchback intervals are multiplied by a factor of 0.1 for better visibility.
Other Images in This Article
Copyright and Terms & Conditions
© 2026. The Author(s). Published by the American Astronomical Society.

Copyright ©
2026 Astronomy Image Explorer. All Rights Reserved.
