

Image Details
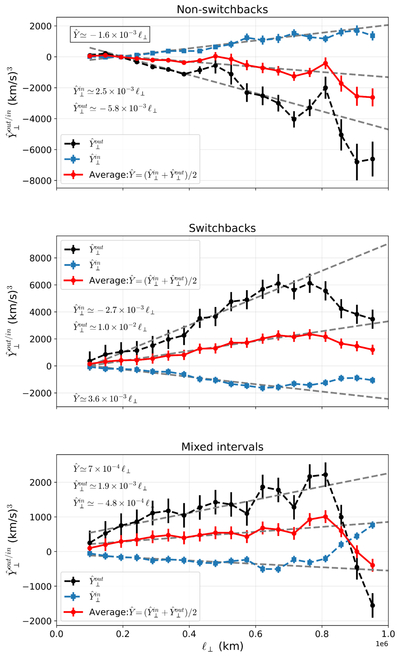
Caption: Figure 3.
Ensemble-averaged structure functions associated with outward (﹩{\hat{Y}}_{\perp }^{{\rm{out}}}﹩; black dashed curves with circles) and inward (﹩{\hat{Y}}_{\perp }^{{\rm{in}}}﹩; blue dashed curves with squares) Alfvénic fluctuations as functions of the perpendicular lag, ℓ⊥. The red solid curves show the average quantity ﹩\hat{Y}=({\hat{Y}}_{\perp }^{{\rm{out}}}+{\hat{Y}}_{\perp }^{{\rm{in}}})/2﹩. The top, middle, and bottom panels correspond to nonswitchback intervals, switchback intervals, and the combined (mixed) sample, respectively. Gray dashed lines indicate the linear fit scaling within the inertial range.
Other Images in This Article
Copyright and Terms & Conditions
© 2026. The Author(s). Published by the American Astronomical Society.

