

Image Details
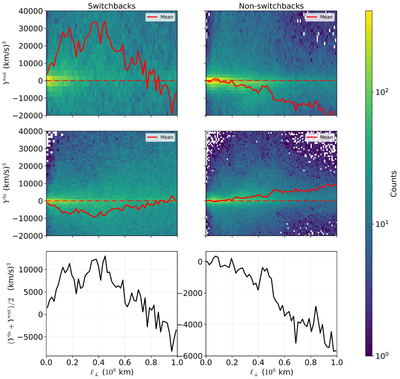
Caption: Figure 2.
The top and middle rows show the distributions of the local estimates of the mixed third-order structure functions, Yout(ℓ⊥) and Yin(ℓ⊥), respectively, as a function of the perpendicular lag ℓ⊥. The color scale indicates the number of samples contributing to each bin, while the red curves denote the corresponding mean values. The bottom row displays the average quantity Y = (Yout + Yin)/2. The quantities plotted here are calculated using the two intervals shown in Figure 1.
Other Images in This Article
Copyright and Terms & Conditions
© 2026. The Author(s). Published by the American Astronomical Society.

Copyright ©
2026 Astronomy Image Explorer. All Rights Reserved.
