

Image Details
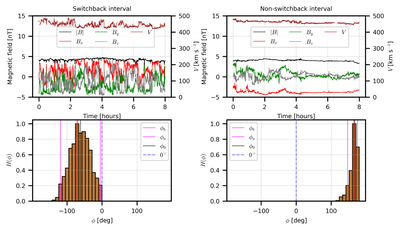
Caption: Figure 1.
Top panels show the magnetic-field components, magnetic-field magnitude (left y-axis), and bulk solar-wind speed (right y-axis) for a representative switchback interval (left) and nonswitchback interval (right). Bottom panels show the normalized histogram of the magnetic-field angle ϕ for the same intervals. The black vertical line marks ϕ0, the angle of the mean magnetic field B_0and the red vertical line marks the angle of the most probable magnetic-field direction, Bm. The magenta vertical lines indicate ϕa and ϕb, which define the angular extent of the dominant distribution around ϕ0.
Other Images in This Article
Copyright and Terms & Conditions
© 2026. The Author(s). Published by the American Astronomical Society.

Copyright ©
2026 Astronomy Image Explorer. All Rights Reserved.
