

Image Details
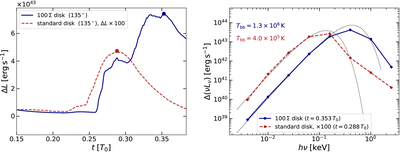
Caption: Figure 6.
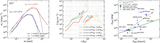
Effect of the disk surface density on the flare, for the θ = 135∘ collision. (Left) Excess luminosity ΔL, measured at y/r = −1.2 below the midplane after subtracting the reference run without a star, for a disk with 100 × the fiducial surface density (100 Σ, blue solid) and for the standard disk with its ΔL multiplied by 100 (red dashed). The time axis begins at t = 0.15 T0 to exclude the initial relaxation transient. Filled circles mark the light-curve peaks. (Right) Excess spectra Δ(νLν) at those two peaks, with best-fitting single-temperature blackbodies (dotted) at Tbb = 1.3 × 10⁶ K (109 eV) and Tbb = 4.0 × 10⁵ K (34 eV), respectively.
Other Images in This Article
Copyright and Terms & Conditions
© 2026. The Author(s). Published by the American Astronomical Society.

