

Image Details
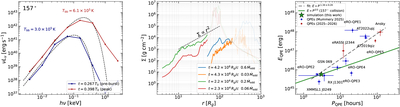
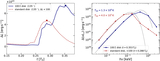
Caption: Figure 5.
(Left) SEDs of the luminosity νLν before the outburst (t = 0.267 T0, preburst) and at peak (t = 0.398 T0) for the θ = 157∘ case. Dashed black curves show best-fitting blackbody spectra, at Tbb = 3.0 × 10⁵ K and Tbb = 6.1 × 10⁵ K, respectively. (Middle) Disk surface density Σ as a function of radius r at the end of the simulations for four runs: AGN 0.2 (green) and AGN 0.07 (red) from Y.-F. Jiang et al. (2019), and AGNUVB0.6 (blue) and AGNUVB0.03 (orange) from Y.-F. Jiang et al. (2025). The dashed black line indicates the Σ ∝ r2 scaling. Dotted portions of each curve denote radii significantly affected by the torus initialization. (Right) Radiated energy per eruption EQPE against recurrence time PQPE for the observed QPE population: blue points are the compilation of A. Mummery (2025); red points are sources reported since. The green star is the flare energy measured in our 157∘ simulation, emerging through one disk surface, plotted at the simulated orbital period T0 = 3.04 hr, and the green line extends it as E ∝ P2/3 (Equation (5)) with no free parameters. The gray dashed line is a power-law fit to the observed points.
Other Images in This Article
Copyright and Terms & Conditions
© 2026. The Author(s). Published by the American Astronomical Society.

