

Image Details
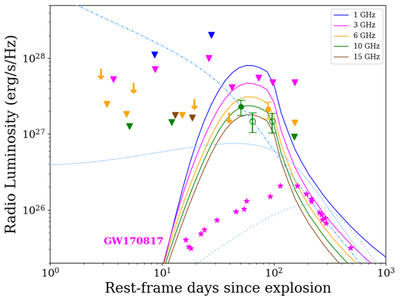
Caption: Figure 4.
Radio observations of SN 2025ulz. We show upper limits (downward triangles), ≥5σ detections (dots), and 3σ–4.9σ detections (open circles). Downward triangles also mark ≥3σ emission in the search region likely due to host-galaxy light (see Table 1). Additional 6 GHz upper limits from B. O’Connor et al. (2025b) are included (arrows). For comparison, we plot the 3 GHz light curve of GW170817 (S. Makhathini et al. 2021) (magenta stars). Light blue dotted–dashed, dotted, and densely dotted curves show models from B. O’Connor et al. (2025b), while solid curves are our models computed with PyBlastAfterglowMag (V. Nedora et al. 2025, 2023). See Section 3.2 for discussion.
Other Images in This Article

Copyright and Terms & Conditions
© 2026. The Author(s). Published by the American Astronomical Society.

