

Image Details
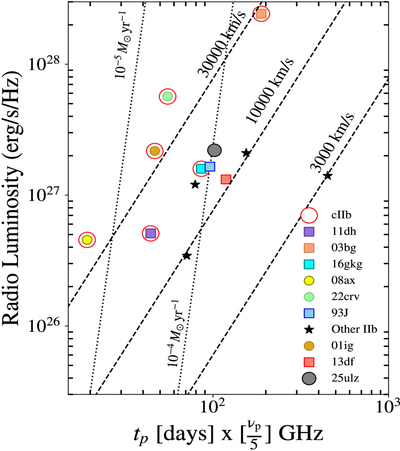
Caption: Figure 3.
A Chevalier diagram (peak radio luminosity versus peak time) with the 10 GHz detection (likely peak) of SN 2025ulz (gray dot) compared to that of other Type IIb SNe (as indicated in the legend). Lines of constant shock velocity and mass-loss rate are shown. Type cIIb explosions thought to be linked to compact progenitors are highlighted with open red circles. See Section 3.1 for discussion.
Other Images in This Article

Copyright and Terms & Conditions
© 2026. The Author(s). Published by the American Astronomical Society.

Copyright ©
2026 Astronomy Image Explorer. All Rights Reserved.
