

Image Details
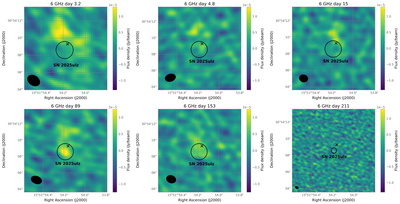
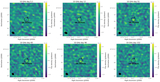
Caption: Figure A2.
Observations of the SN 2025ulz field carried out at ν ≈ 6 GHz under our JAGWAR program with the VLA in its CnB (top-left and top-center panels), B (top-right, bottom-left, and center-left panels), and A (bottom-right panel) configurations. In all panels except for the bottom-right one, the black circle marks a region of radius equal to the nominal FWHM of the VLA synthesized beam at ν ≈ 6 GHz and in B configuration (1﹩\mathop{.}\limits^{{\unicode{x02033}}}﹩0), centered on the position of SN 2025ulz as determined by the brightest pixel in HST images. This circle ha a radius of 0﹩\mathop{.}\limits^{{\unicode{x02033}}}﹩33 (nominal VLA FWHM at ν ≈ 6 GHz and in A configuration) in the bottom-right panel. In Table 1, we report the peak radio flux densities measured within this circular region (if above 3 × RMS) and their positional offset and PA from the HST position of SN 2025ulz. The actual VLA beam is plotted as a black ellipse in each panel. The optical position of the host galaxy (SDSS J155154.16+305409.3) center is marked with a black cross. Map colors span flux density values in between ≈−5 × RMS and +5 × RMS (see Table 1 for the RMS value of each image). Emission from a faint counterpart from SN 2025ulz is detected at the ≈5σ level on day 89.
Other Images in This Article

Copyright and Terms & Conditions
© 2026. The Author(s). Published by the American Astronomical Society.

