

Image Details
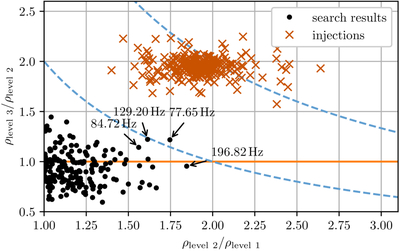
Caption: Figure 4.
Ratios of follow-up statistics for candidates from the search, and from simulated signals. This plot shows all of the candidates that survived level 2 of follow-up (see Section 4 and Table 3), both from the main search and from the analysis of the simulated signal injections described in Section 5. It shows the ratios of the S/N ρ after follow-up level 1 (a refined demod CrossCorr search with Tmax = 24 hr), level 2 (Tmax = 4 days), and level 3 (Tmax = 16 days). The blue dashed lines are at constant values of ρlevel 3/ρlevel 1 equal to 2 and 4, the latter being the theoretically expected value. There are no points with ρlevel 2/ρlevel 1 < 1, because those candidates do not survive level 2 follow-up and are therefore not subjected to level 3 follow-up. From the construction of the statistic in J. T. Whelan et al. (2015), the naïve expectation is that the S/N will roughly double each time Tmax is quadrupled. We see that the follow-ups of injections (red crosses) are clustered around this relationship, while the follow-ups of search candidates (black dots) are not. The four candidates which increase their S/N by the largest factor from level 1 to level 3 are indicated, labeled by their frequencies, and considered in Table 4.
Other Images in This Article
Copyright and Terms & Conditions
© 2026. The Author(s). Published by the American Astronomical Society.

