

Image Details
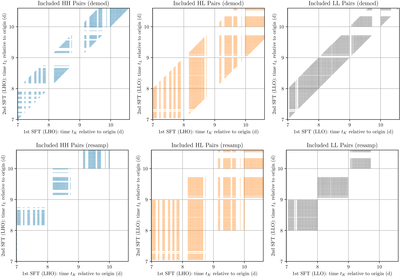
Caption: Figure 1.
Representative illustrations of the SFT pairs used in constructing the cross-correlation statistics. The left column (“HH”) shows the times of pairs where both SFTs are from LIGO Hanford Observatory (LHO), the middle (“HL”) where the first is from LHO and the second is from LIGO Livingston Observatory (LLO), and the right (“LL”) where both are from LLO. Note that these plots only show a few days of data; the analysis included data from the entire O4a run. The horizontal and vertical gaps correspond to times where no science-quality data exist for that detector, and so no SFTs were made. The top row shows the original “demod” construction used in Equation (8): a pair of SFTs is included in the sum if the start times differ by Tmax or less; in this case, Tmax = 24 hr. Each pair is only counted once, so for HH and LL pairs, we only include pairs with tK < tL. This was the setup used for the analyses in B. P. Abbott et al. (2017b, 2022a) and J. T. Whelan et al. (2023), albeit with lower Tmax values, and is also used for the follow-up described in Section 4. For the resampling construction of G. D. Meadors et al. (2018), used in the present search, the SFT data are processed together (with gaps replaced by zeros) into time intervals of duration Tmax. As those are correlated with other such intervals that lie within Tmax, the effective set of SFT pairs is as shown in the bottom (“resamp”) row. One effect of this is that more HL SFT pairs are included in the calculation, so that the same nominal Tmax value corresponds to a deeper search.
Other Images in This Article
Copyright and Terms & Conditions
© 2026. The Author(s). Published by the American Astronomical Society.

