

Image Details
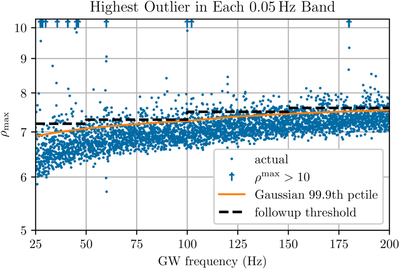
Caption: Figure 3.
Selection of follow-up threshold as a function of GW frequency. The blue dots represent the highest S/N ρmax in each 0.05 Hz band. If the data contained no signal and only Gaussian noise, each template in the parameter space would have some chance of producing a statistic value exceeding a given threshold. Using the number of templates in each 0.05 Hz band, we can estimate the expected distribution of the highest S/N in the band. The solid orange curve shows the 99.9th percentile of this distribution, i.e., the level at which we would expect 10−3 false alarms per 0.05 Hz, or one per 50 Hz. Due to the non-Gaussian nature of the tail of the distribution of ρ, the actual number of outliers is considerably higher. To keep the follow-up volume manageable, we set the thresholds indicated by the black dashed line and shown in Table 3.
Other Images in This Article
Copyright and Terms & Conditions
© 2026. The Author(s). Published by the American Astronomical Society.

