

Image Details
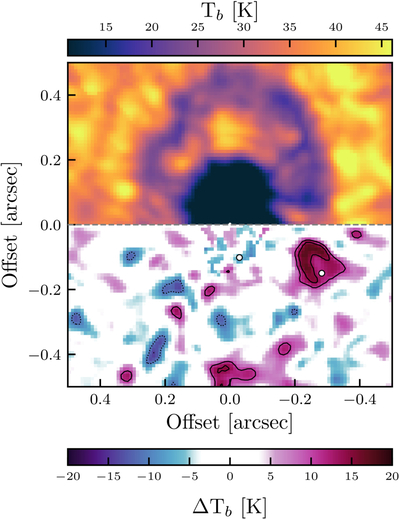
Caption: Figure 8.
Composite peak intensity image, with the observed peak intensity map in the north and the residuals obtained by subtracting the northern side from the southern side, in the south. Contours at 3σ, 4σ, 5σ are overlaid.
Other Images in This Article
Show More
Copyright and Terms & Conditions
© 2026. The Author(s). Published by the American Astronomical Society.

Copyright ©
2026 Astronomy Image Explorer. All Rights Reserved.
