

Image Details
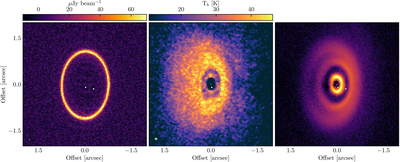
Caption: Figure 1.
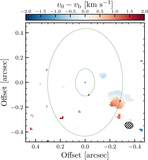
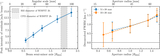
Left: 0.88 mm continuum intensity at a resolution of 19 × 13 mas. Middle: 12CO J = 3−2 peak intensity map, at a resolution of 67 × 52 mas. The beams are shown in the bottom-left corner. Right: scattered light H-band SPHERE image (R. F. van Capelleveen et al. 2025) (resolution ∼40 mas). The locations of the two planets are marked with white dots.
Other Images in This Article
Show More
Copyright and Terms & Conditions
© 2026. The Author(s). Published by the American Astronomical Society.

Copyright ©
2026 Astronomy Image Explorer. All Rights Reserved.
