

Image Details
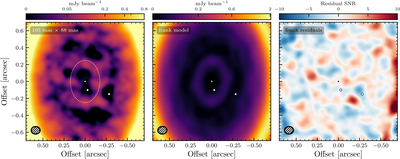
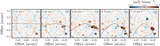
Caption: Figure 2.
Left: continuum intensity (med-res) zoomed in on the cavity, showing faint surface brightness emission including a faint ring at ﹩0\mathop{.}\limits^{{\prime\prime} }25﹩ indicated by a dotted ellipse. Middle: corresponding frank model. Right: residuals obtained after subtracting the frank model from the data. The beams are shown in the lower-left corner. The locations of the planets are marked with dots, and that of the star with a plus sign.
Other Images in This Article
Show More
Copyright and Terms & Conditions
© 2026. The Author(s). Published by the American Astronomical Society.

Copyright ©
2026 Astronomy Image Explorer. All Rights Reserved.
