

Image Details
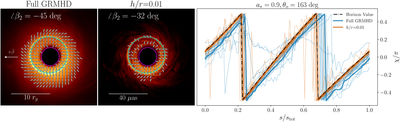
Caption: Figure 5.
The EVPA χ around the inner shadow taken from an MAD GRMHD simulation with spin a* = 0.9 and viewing angle θo = 163 deg and raytraced at 230 GHz with ipole. Left: the averaged GRMHD image with mass-to-distance ratio scaled to that of M87*. The inner shadow is indicated by a magenta contour while the critical curve is shown in cyan. Tick marks indicate the local averaged EVPA across the image. Center: The average image from raytraced snapshots where emission is restricted to lie very close to the equatorial plane, in a wedge with aspect ratio h/r = 0.01. Right: the EVPAs extracted from the GRMHD snapshots (thin blue lines) and time average (thick blue lines), the corresponding EVPAs from the simulation with restricted equatorial emission (orange). The EVPAs are plotted around the inner-shadow contour as a function of normalized arc length s measured counterclockwise from the ﹩+\hat{\beta }﹩-axis, which points to the left to match the on-sky orientation of M87*. The predicted horizon value for equatorial emission (Equation (33)) is indicated by the black dashed line.
Other Images in This Article
Copyright and Terms & Conditions
© 2026. The Author(s). Published by the American Astronomical Society.

