

Image Details
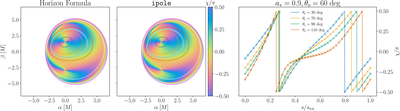
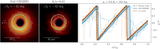
Caption: Figure 3.
Comparison of the universal horizon formula for the EVPA (Equation (31)) with raytracing results from the ipole code for an a* = 0.9 black hole viewed at θo = 60 deg. Left: The cyclic colormap shows the universal EVPA formula (Equation (31)) inside the critical curve. Center: Numerical results from ipole obtained from confining emission to a thin shell surrounding the horizon in a monopole magnetosphere. Right: The EVPA χ around the n = 0 contours of constant horizon colatitude θs = 30, 70, 90, 110 deg as a function of the fractional arc length s counterclockwise around the curve from the ﹩+\hat{\beta }﹩-axis. These contours are indicated on the left and center plots in the same color. The analytic horizon formula is plotted as the solid lines and EVPA values sampled from the ipole image are indicated with crosses.
Other Images in This Article
Copyright and Terms & Conditions
© 2026. The Author(s). Published by the American Astronomical Society.

