

Image Details
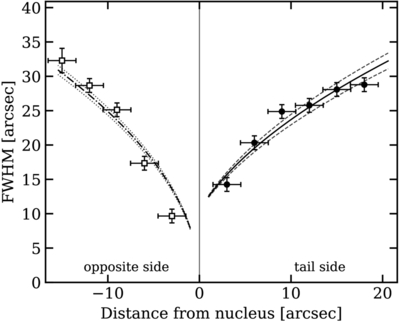
Caption: Figure A2.
FWHM of the dust tail as a function of distance from the nucleus on 2026 January 18. Positive and negative distances denote the tail and antitail sides, respectively. Horizontal error bars indicate the segments along the projected tail axis over which the profiles were measured, and the vertical error bars show the FWHM uncertainties. Filled circles and open squares mark the tail and antitail measurements. The solid and dashed–dotted curves are separate fits to Equation (4), and the dashed–dotted curves show the corresponding ±1σ velocity ranges. The vertical line marks the nucleus.
Other Images in This Article
Copyright and Terms & Conditions
© 2026. The Author(s). Published by the American Astronomical Society.

Copyright ©
2026 Astronomy Image Explorer. All Rights Reserved.
