

Image Details
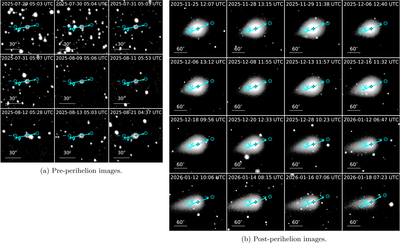
Caption: Figure 1.
ZTF image sequences of 3I before and after perihelion. Panel (a) shows the preperihelion images, and panel (b) shows the postperihelion images. The observation time is marked in each panel. The white scale bars indicate angular distances of 30″ in panel (a) and 60″ in panel (b). All images are oriented with north up and east to the left. The cyan arrows labeled ⊙, −⊙, and −v indicate the projected solar, antisolar, and antivelocity directions, respectively, and the cyan cross marks the photometric center.
Other Images in This Article
Copyright and Terms & Conditions
© 2026. The Author(s). Published by the American Astronomical Society.

Copyright ©
2026 Astronomy Image Explorer. All Rights Reserved.
