

Image Details
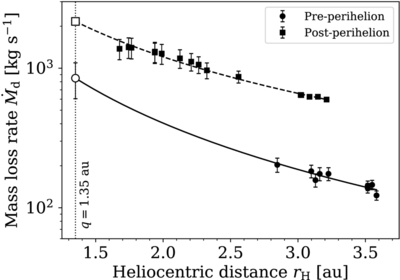
Caption: Figure A3.
Dust mass-loss rate as a function of heliocentric distance. Filled circles and filled squares show the pre- and postperihelion measurements, respectively, derived from the largest photometric apertures. Error bars represent the uncertainties. The solid and dashed curves show separate power-law fits, giving ﹩{\dot{M}}_{{\rm{d}}}\propto {r}_{{\rm{H}}}^{-1.88\pm 0.34}﹩ before perihelion and ﹩{\dot{M}}_{{\rm{d}}}\propto {r}_{{\rm{H}}}^{-1.54\pm 0.09}﹩ after perihelion. The vertical dotted line marks the perihelion distance, q = 1.35 au, and the open symbols show the corresponding extrapolated mass-loss rates at perihelion.
Other Images in This Article
Copyright and Terms & Conditions
© 2026. The Author(s). Published by the American Astronomical Society.

