

Image Details
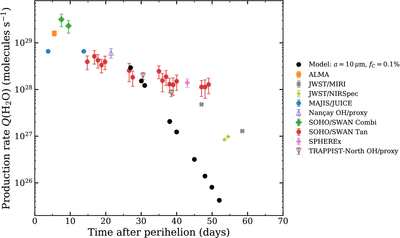
Caption: Figure C3.
Comparison between observed water-production rates and the water production estimated from the optical scattering cross section. The black points show the model for a = 10 μm, fC = 0.1%, and an assumed icy-grain albedo pice = 0.5. Colored symbols show observed H2O production rates, with OH-based values shown as proxies where applicable (N. Biver et al. 2026; M. Belyakov et al. 2026; D. Bockelee-Morvan et al. 2026; M. Combi et al. 2026; C. M. Lisse et al. 2026; N. X. Roth et al. 2026; L. E. Salazar Manzano et al. 2026; H. Tan et al. 2026).
Other Images in This Article
Copyright and Terms & Conditions
© 2026. The Author(s). Published by the American Astronomical Society.

Copyright ©
2026 Astronomy Image Explorer. All Rights Reserved.
