

Image Details
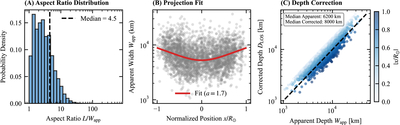
Caption: Figure 3.
Geometric statistics and depth correction. (A) Distribution of the filament aspect ratio (L/Wapp). (B) Apparent width Wapp as a function of normalized heliocentric position x/R⊙. The red curve shows the best-fit projection model (Equation (12)), yielding a depth-to-width ratio of a = 1.7. (C) Comparison between the apparent depth (assumed equal to Wapp) and the geometrically corrected depth DLOS, color encoded by heliocentric distance ∣x/R⊙∣. The dashed line indicates the one-to-one correspondence.
Other Images in This Article
Copyright and Terms & Conditions
© 2026. The Author(s). Published by the American Astronomical Society.

Copyright ©
2026 Astronomy Image Explorer. All Rights Reserved.
