

Image Details
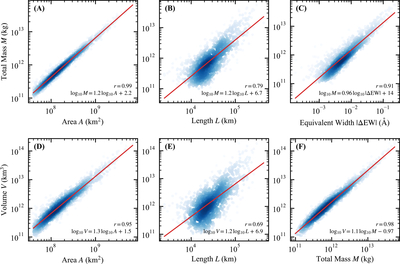
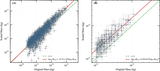
Caption: Figure 4.
Scaling relations among the parameters of the filaments in log–log space. Point colors encode the local number density estimated via kernel density estimation, with darker blue indicating higher concentration. The red solid lines show the least-squares linear fits in log–log space, with the best-fit relations and Pearson correlation coefficients r given in the lower-right corners. Panels (A)–(C) present the scaling relations between total mass M and area A (A), length L (B), and equivalent width ∣ΔEW∣ (C). Panels (D)–(F) show the geometric scaling relations between the derived volume V and area A (D), length L (E), and total mass M (F).
Other Images in This Article
Copyright and Terms & Conditions
© 2026. The Author(s). Published by the American Astronomical Society.

