

Image Details
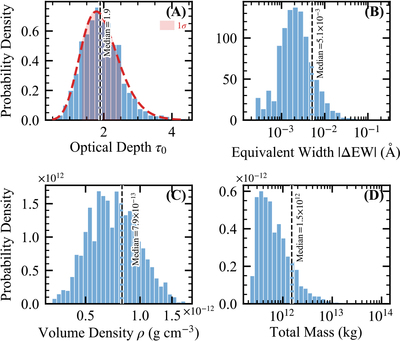
Caption: Figure 2.
Distributions of physical parameters derived from the Sun-as-a-star cloud-model fitting for the full filament sample. (A) Optical depth τ0; (B) absolute equivalent width ∣EW∣ in Hα; (C) volume density ρ; (D) total mass. The dashed vertical line in each panel marks the median of the distribution. In panel (A), the red dashed curve shows the best-fit log-normal distribution selected by the BIC, and the shaded region indicates the 1σ interval [τ0 = 1.39, 2.50]. The y-axis in all panels represents the normalized probability density.
Other Images in This Article
Copyright and Terms & Conditions
© 2026. The Author(s). Published by the American Astronomical Society.

Copyright ©
2026 Astronomy Image Explorer. All Rights Reserved.
