

Image Details
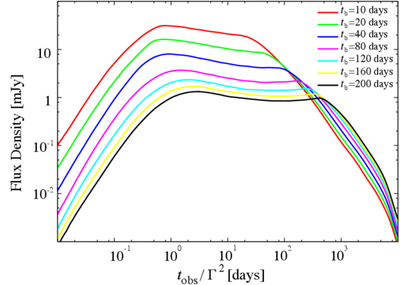
Caption: Figure 4.
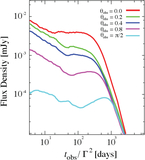
Radio light curves at ν = 4.86 GHz for the constantly powered, one-dimensional simulations shown in Figure 3. The colored curves correspond to continuously powered blast waves with different energy injection times, tb. Increasing the duration of energy injection systematically lowers the peak radio luminosity and delays the time of maximum emission.
Other Images in This Article
Copyright and Terms & Conditions
© 2026. The Author(s). Published by the American Astronomical Society.

Copyright ©
2026 Astronomy Image Explorer. All Rights Reserved.
