

Image Details
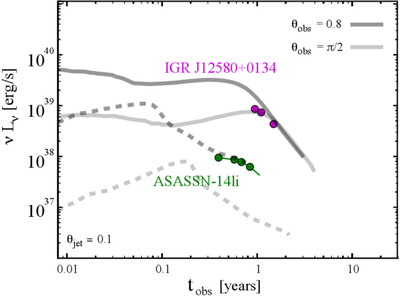
Caption: Figure 11.
Comparison between the radio light curves predicted by the fallback-powered jet model and the observed radio luminosities of the early sample of radio-detected tidal disruption events. The models adopt the fallback luminosity history shown in Figure 1 for a 107 M⊙ black hole and an initial jet half-opening angle of θjet = 0.1. Solid curves correspond to the fiducial circumnuclear density profile, while dashed curves show models with an ambient density lower by 1 order of magnitude. The observational data are shown for comparison (K. D. Alexander et al. 2016, 2017; S. van Velzen et al. 2016).
Other Images in This Article
Copyright and Terms & Conditions
© 2026. The Author(s). Published by the American Astronomical Society.

Copyright ©
2026 Astronomy Image Explorer. All Rights Reserved.
