

Image Details
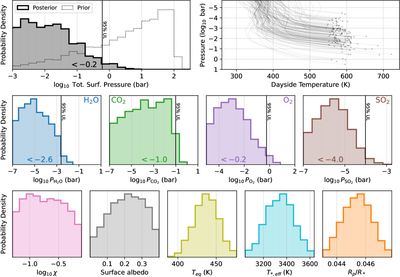
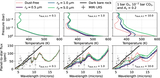
Caption: Figure 3.
1D marginalized posterior distributions for key parameters in the atmospheric fit to the 16-bin MIRI LRS eclipse spectrum. The top-left panel shows the derived posterior on total surface pressure (solid black line), compared to implicit prior (dotted black line). The top-right panel shows pressure–temperature profiles sampled from the posterior. The climate-constrained inversion places a 95% upper limit of 0.6 bar on the surface pressure. If an atmosphere is present, a tenuous CO2 (or O2) dominated atmosphere is most probable.
Other Images in This Article
Copyright and Terms & Conditions
© 2026. The Author(s). Published by the American Astronomical Society.

Copyright ©
2026 Astronomy Image Explorer. All Rights Reserved.
