

Image Details
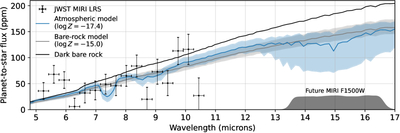
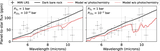
Caption: Figure 2.
The atmospheric and bare-rock fits to the 16-bin MIRI LRS eclipse spectrum. Lines and shaded bands show the median model spectrum and 1σ credible interval. The black line shows the expected eclipse depth for a dark bare rock, assuming the mean planetary and stellar parameters of LTT 1445A b. Gray shading near 15 μm marks the throughput curve of the planned MIRI F1500W photometric observations. The bare-rock model is moderately favored by the Bayesian evidence, with ﹩\mathrm{log}{Z}_{{\rm{bare}}}=-15.0﹩ and ﹩\mathrm{log}{Z}_{{\rm{atm}}}=-17.4﹩.
Other Images in This Article
Copyright and Terms & Conditions
© 2026. The Author(s). Published by the American Astronomical Society.

Copyright ©
2026 Astronomy Image Explorer. All Rights Reserved.
