

Image Details
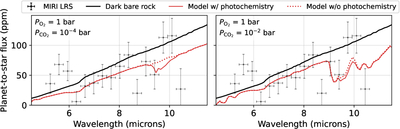
Caption: Figure C1.
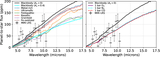
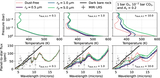
The impact of photochemistry on the emission spectrum of LTT 1445A b. Two atmospheres are simulated: 1 bar O2 with 10−4 bar CO2 (left panel), and 1 bar O2 with 10−2 bar CO2 (right panel). Solid lines are the results of coupled photochemical-climate simulations, and dotted lines are climate-only models. This sensitivity test demonstrates that photochemically produced O3 has a relatively small impact on the planet’s emission spectrum when compared to the existing low-precision data.
Other Images in This Article
Copyright and Terms & Conditions
© 2026. The Author(s). Published by the American Astronomical Society.

Copyright ©
2026 Astronomy Image Explorer. All Rights Reserved.
