

Image Details
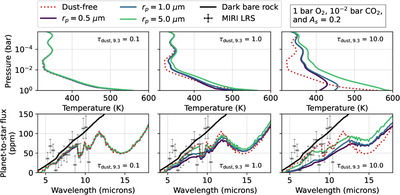
Caption: Figure B1.
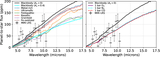
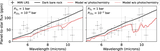
The impact of dust on the P-T profile and emission spectrum of LTT 1445A b. All models have 1 bar of O2, 0.01 bar CO2, and a 0.2 surface albedo. The red dotted line is an aerosol-free model, compared to dusty simulations with various particle radii and 9.3 μm dust column optical depths. Dust mutes spectral features, causing the atmosphere to have lower emission in the LRS bandpass and higher emission near 15 μm.
Other Images in This Article
Copyright and Terms & Conditions
© 2026. The Author(s). Published by the American Astronomical Society.

Copyright ©
2026 Astronomy Image Explorer. All Rights Reserved.
