

Image Details
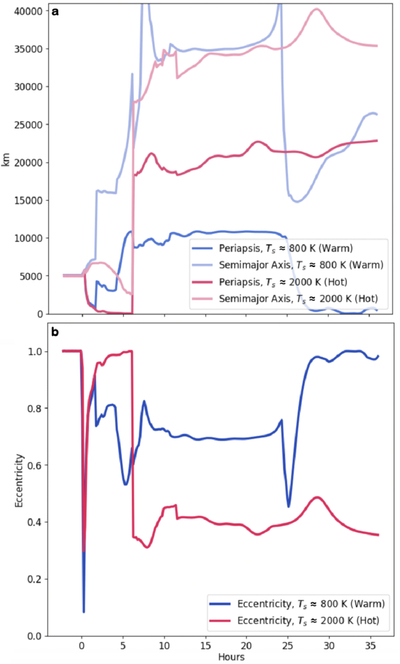
Caption: Figure 3.
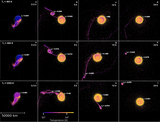
Comparison of the time evolution of an intact and quasi-intact satellite, utilizing the orbital parameters for the intact satellite from simulations in Figures 2(e)–(h) (Tsurf ≈ 800 K) and 2(i)–(l) (Tsurf ≈ 2000 K). (a) Evolution of the proto-Moon’s semimajor axis and periapsis measured in distance from the proto-Earth. (b) The evolution of the proto-Moon’s eccentricity. Blue lines correspond to the warm (∼800 K) scenario; red lines correspond to the hot (∼2000 K) scenario. The sharp transition that occurs at ∼7–9 hr for both Tsurf ≈ 800 and 2000 K corresponds to the separation of the initial satellites seen in Figures 2(g) and (h). The sharp transition for Tsurf ≈ 800 K at ∼ 25 hr corresponds to the semistable satellite’s tidal disruption.
Other Images in This Article
Copyright and Terms & Conditions
© 2026. The Author(s). Published by the American Astronomical Society.

