

Image Details
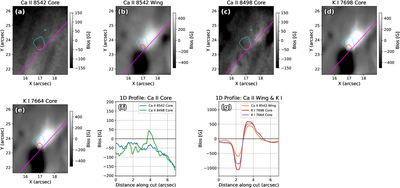
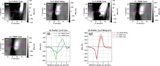
Caption: Figure 4.
Results of the WFA applied to Event 1. The red and cyan contours on the WFA maps are the same as those in Figure 2, indicating the intensity enhancements in the Ca II red wing and Ca II blue wing (panels (e) and (f) of Figure 2), respectively. The magenta line is oriented so as to cross the two opposite-polarity patches of the photospheric LOS magnetic field (e.g., panel (d)). The 1D spatial profiles of the line-of-sight magnetic field along the magenta line are displayed in panels (f) and (g). The spatial coordinates are given in arcsec and correspond to those of Figure 1.
Other Images in This Article
Copyright and Terms & Conditions
© 2026. The Author(s). Published by the American Astronomical Society.

Copyright ©
2026 Astronomy Image Explorer. All Rights Reserved.
