

Image Details
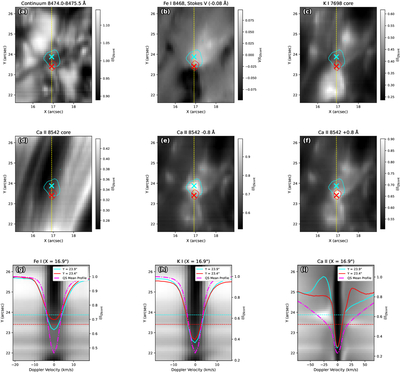
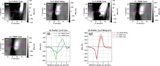
Caption: Figure 2.
Spectral features of Event 1. (a) Continuum intensity (averaged over 8474.0–8475.5 Å), (b) Stokes V map of Fe I 8468 Å (at −0.08 Å from the line core), and (c) line-core intensity of K I 7698 Å. (d) Ca II 8542 Å line-core intensity, and (e) intensities at the blue wing (−0.8 Å) and (f) red wing (+0.8 Å) of the Ca II line. The spatial coordinates are given in arcsec and correspond to those of Figure 1. All intensities and the Stokes V map in panels (a)–(f) are normalized by the quiet-Sun continuum, computed from the quiet-Sun reference region defined in Figure 1. The red and cyan contours indicate the regions of intensity enhancement in the Ca II red wing and Ca II blue wing, respectively. The yellow dashed line indicates the position for the wavelength–space plots shown in panels (g)–(i). The wavelength scale is converted to Doppler velocity, which is defined relative to the mean line centroid of the quiet-Sun reference region within the same dataset (the white dashed rectangle in Figure 1), i.e., taken as 0 km s−1. The cyan and red crosses overplotted on panels (a)–(f) mark the slit positions whose Stokes I profiles are shown by the cyan and red curves in panels (g)–(i), respectively (also normalized by IQScont of each line). The magenta lines in panels (g)–(i) represent the mean Stokes I profiles of the quiet Sun.
Other Images in This Article
Copyright and Terms & Conditions
© 2026. The Author(s). Published by the American Astronomical Society.

