

Image Details
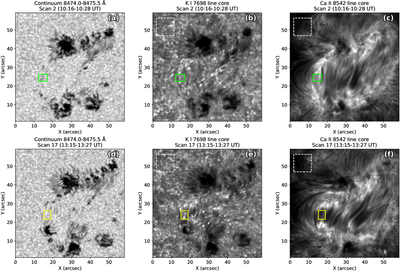
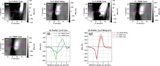
Caption: Figure 1.
Examples of Stokes I maps in the continuum (averaged over 8474.0–8475.5 Å), the K I 7698 Å line core, and the Ca II 8542 Å line core, acquired with SUNRISE III/SCIP. Panels (a)–(c) show the second scan (10:17–10:29 UT), in which Event 2 was identified; the green rectangle in each top-row panel marks the field of view of Event 2. Panels (d)–(f) show the 17th scan (13:16–13:28 UT), in which Event 1 was identified; the yellow rectangle in each bottom-row panel marks the field of view of Event 1. The white dashed rectangle (visible near the upper-left of each panel) marks the quiet-Sun reference region used for computing the mean quiet-Sun Stokes I profile. The x- and y-axes are given in arcsec and correspond to the scanning and slit directions, respectively. An animation of this figure, covering the 20 completed scans (10:05–14:04 UT), is available.
(An animation of this figure is available in the online article.)
(An animation of this figure is available.)
The video/animation of this figure is available in the online journal.
Other Images in This Article
Copyright and Terms & Conditions
© 2026. The Author(s). Published by the American Astronomical Society.

