

Image Details
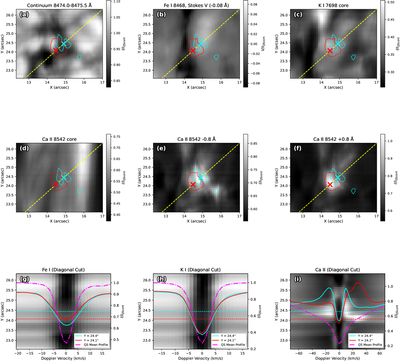
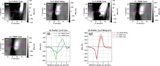
Caption: Figure 3.
The figure format and symbols are the same as in Figure 2, but for a different event (Event 2). In contrast to Figure 2, the wavelength–space plots in panels (g)–(i) are extracted along the inclined yellow dashed line shown in panels (a)–(f). The spectra sampled along this cut are displayed as a function of the Y coordinate of the sampling points; the vertical axis of panels (g)–(i) therefore covers the same Y range as panels (a)–(f), and does not represent the distance along the cut.
Other Images in This Article
Copyright and Terms & Conditions
© 2026. The Author(s). Published by the American Astronomical Society.

Copyright ©
2026 Astronomy Image Explorer. All Rights Reserved.
