

Image Details
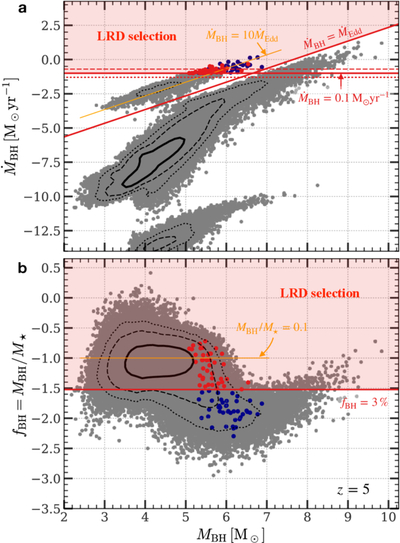
Caption: Figure 1.
Selection of LRDs. Each dot represents a BH produced by the model at z = 5 in the planes of (a) BHAR (﹩{\dot{M}}_{{\rm{BH}}}﹩) vs. BH mass and (b) BH-mass fraction (fBH ≡ MBH/M⋆) vs. BH mass. In each panel, inner to outer contours encompass 68%, 95%, and 99.7%, respectively, of all BHs. The orange line indicates the typical ﹩{\dot{M}}_{{\rm{BH}}}﹩ or fBH of the bursty branch. The default selection criterion for LRDs is marked by red shading enclosed by red solid lines, and LRDs so selected are shown by red dots. BHs passing the selection for ﹩{\dot{M}}_{{\rm{BH}}}﹩ but not for fBH are shown by blue dots. Red dashed and dotted lines in panel (a) show alternative selection criteria with varied thresholds of BHAR. The figure shows that the observed LRDs are the tip of the branch shaped by nuclear bursts (see Section 2.2 for details).
Other Images in This Article
Copyright and Terms & Conditions
© 2026. The Author(s). Published by the American Astronomical Society.

