

Image Details
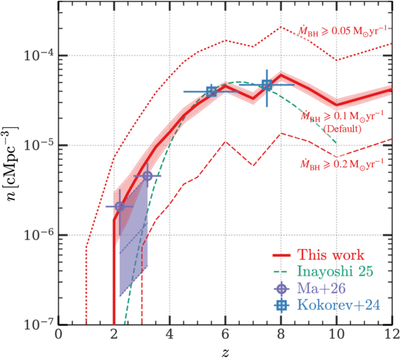
Caption: Figure 2.
Number density of LRDs as a function of redshift. Here we show the predicted number density (n) of LRDs selected by our default criterion (red solid) and the criteria with alternative thresholds of ﹩{\dot{M}}_{{\rm{BH}}}﹩ (red dashed and dotted). The curve with shading represents the median and 16th–84th percentile range of n among 100 random samples for the durations of nuclear bursts (see Section 2.1). For comparison, we show the observations by Y. Ma et al. (2026) and V. Kokorev et al. (2024) and the empirical result of K. Inayoshi (2025). Three dotted lines associated with the purple band indicate the expected number density if 100%, 30%, and 10%, respectively, of the selected candidates in Y. Ma et al. (2026) are LRDs. The model recovers the piecewise evolution of LRD number density found in observations and ties the physical origin of this evolution to the hierarchical nature of halo assembly that is determined by the ΛCDM cosmology (see Section 3.1 for details).
Other Images in This Article
Copyright and Terms & Conditions
© 2026. The Author(s). Published by the American Astronomical Society.

