

Image Details
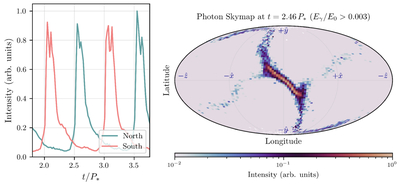
Caption: Figure 5.
Left: synchrotron lightcurves over two stellar periods for a northward observer (blue) and a southward observer (red). Bursts occur twice per period, with duration Δt ∼ 1/6 P*. Right: intensity skymap of high-energy synchrotron photons at t = 2.46 P* on a spherical surface of radius R ∼ 12.4R*, shown in the Mollweide projection, where the center is the +z-axis. Photon energies are normalized to E0 ∝ ϵsync(σ/γrad). The radiation reflects the geometry of the trailing current sheet which is flying out in the +z-direction, concentrated into a solid angle ΔΩ ∼ 0.29 sr.
Other Images in This Article
Copyright and Terms & Conditions
© 2026. The Author(s). Published by the American Astronomical Society.

Copyright ©
2026 Astronomy Image Explorer. All Rights Reserved.
