

Image Details
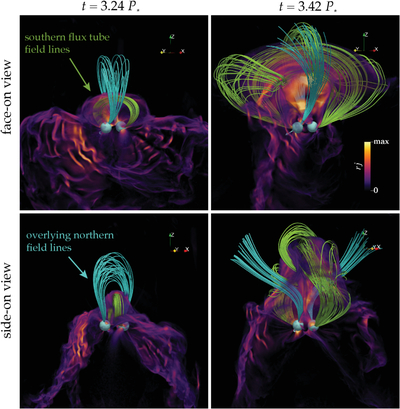
Caption: Figure 2.
Volume rendering of the current density j (compensated by r) at t = 3.24 P* (left) and t = 3.42 P* (right), shown face-on (top) and side-on (bottom) to the forming current sheet. Field lines of the rising southern flux tube are shown in green and the overlying northern arcade in blue. At the earlier time, the flux tube has become perpendicular to the overlying arcade, analogous to pre-eruption conditions in solar CMEs. By the later time, the bubble has risen and the blue field lines are reconnecting behind it, forming the trailing vertical current sheet. Helical field lines in green can be seen in the top right-hand panel, wrapping around the flux tube. An animation showing the full evolution of the burst is available in the online journal. The animation proceeds from t = 3.14 P* through 3.84 P* with the volume rendering rotating about the Z-axis.
(An animation of this figure is available in the online article.)
(An animation of this figure is available.)
The video/animation of this figure is available in the online journal.
Other Images in This Article
Copyright and Terms & Conditions
© 2026. The Author(s). Published by the American Astronomical Society.

