

Image Details
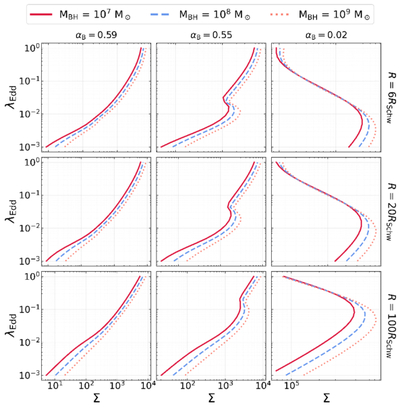
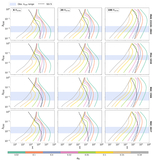
Caption: Figure 2.
Parametric grid of S-curves in the λEdd–Σ plane. Rows correspond to R = 6, 20, 100 RSchw (top to bottom). Columns span the magnetic viscosity from αB = 0.59 (left) to αB = 0.02 (right). Within each panel, line colors and styles denote MBH ∈ {107, 108, 109} M⊙, as marked in the box above.
Other Images in This Article
Copyright and Terms & Conditions
© 2026. The Author(s). Published by the American Astronomical Society.

Copyright ©
2026 Astronomy Image Explorer. All Rights Reserved.
